The assumptions
Due to the nature of ATAR calculation, namely the invariably variable process of alignment, scaling, and internal mark calculation that changes year to year, a set of assumptions have been made by myself, and must be understood by you, to use this calculator in its most accurate and reliable state.
1. Your performance in the year 12 assessments is an accurate and reliable indicator of how you will perform in the HSC exam.
Your internal assessments may be harder, but are probably going to be easier, than the HSC exam. The calculator assumes that you will achieve the same raw mark in your HSC exam as you have over your set of internal assessments.
Keep this in mind when using the calculator.
2. The difficulty of HSC exams remains similar to the 2023 HSC exams.
As the difficulty of HSC exams changes year to year, a different and unknowable set of scaling parameters will apply to calculate your atar. For maximum accuracy, we can approximate this difficulty by actually attempting the 2023 HSC papers, to discover where we would be positioned if we had completed the HSC last year.
3. Your internal rank (i.e. the rank given to you at the end of year 12) for each subject is the same as your external rank (i.e. how you perform relative to others in your cohort on the HSC exam).
This is relevant as your HSC mark that NESA uses is comprised equally of an internal mark, and an external mark, which themselves are closely related to your ranks. This is explained in more detail here.
The verification and understanding of these assumptions by the user (you) allows for an ATAR estimate with remarkably high accuracy, which depending on the user's pattern of study, will be ± 0.15 of your actual ATAR.
Worthy to note, this calculator correctly calculates the aligned -> atar conversion at a higher accuracy than other top-flight atar calculators, such as the Matrix, HSC Ninja, and Talent 100 Atar Calculators. That is, the calculated atar is closer to UAC's estimate (via the UAC atar compass), than these other calculators.
The calculation
An overview
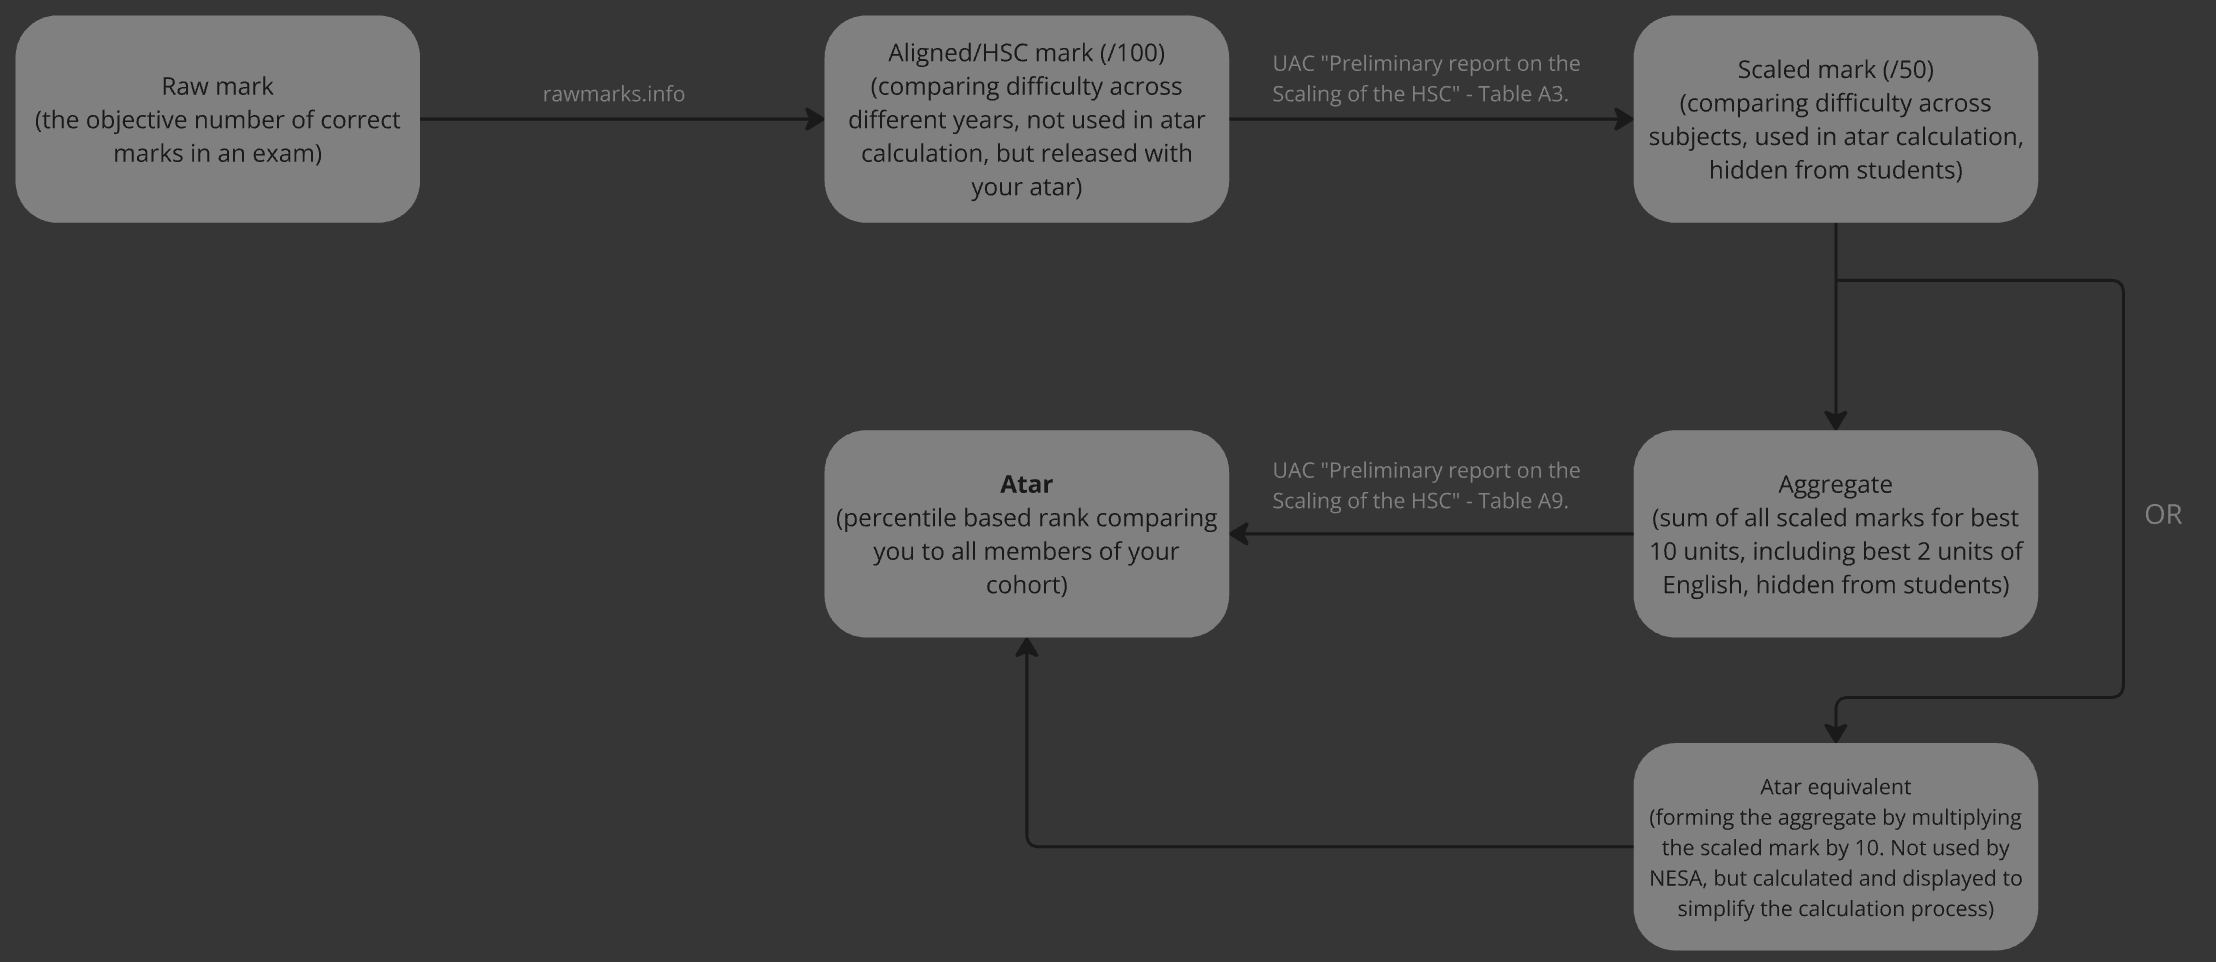
An outline of the steps used to calculate the atar is as follows:
Your raw marks are "aligned" to an aligned mark. The sole purpose of this is to standardise the different marks across year groups, where the difficulty of each course changes. For example, a raw 70% for biology in a difficult 2022 HSC could be equivalent to a raw 85% for biology in the much easier 2023 HSC. i.e. they have the same aligned marks.
These aligned marks correspond to distinct desciptors, called "bands", ranging from 1-6. They are similar to the bands used in NAPLAN, that allow for easy classification of your aligned marks. The band cutoffs that NESA provides (that never change), are located here.
Your aligned marks are then "scaled" to a scaled mark. This is where the well-known and often misunderstood of "scaling" occurs. Some courses "scale up", in that the calculated scaled marks are higher than the inputted aligend marks, and others "scale down". Don't stress too much about this, as it isn't too relevant for most intents and purposes.
The scaled marks from your best 10 units of study (including your best two units of english) are then added together, to form an "aggregate".
This aggregate is then converted into an atar, with percentile-based transformations, that are publically available in the annual UAC scaling report.
Raw to aligned
To convert from your raw marks to aligned marks, up-to-date and verified data from rawmarks.info was used. It turns out, that the process of raw to aligned conversion is calculated through a piecewise-linear function. That is, there is a simple linear equation between each band-cutoff (e.g. 60-70, 90-100), for each subject. You can test this by heading over to rawmarks.info and using two furthest data points within a band (i.e. a raw 76 that aligns to 90, and a raw 93 that aligns to 99), to find the function in the form y = mx + b. Then, test points between these two values and you'll find that all raw marks that you enter will give you the aligned marks available. Outside of the known data on rawmarks.info, the calculator uses a simple linear graph from the lowest known band-cutoff, to the origin. This allows for perfect accuracy within the known data points, and relatively strong accuracy outside of those points. Thankfully, the data on rawmarks tends to be relatively dense, and most users will probably lay between the known data points anyways.
Aligned to scaled
Converting from aligned marks to scaled marks is an once again a set of simple linear equations. The data for this is available in table A3 of the UAC scaling report, where the HSC mark is simply the average of the internal and external marks mentioned earlier, which based on our assumptions, are the same as the calculated aligned mark. You can test this data by choosing a subject, and plotting the points on an online graphing calculator, and you'll find that they fit the aforementioned linear equation, that stretches from the 99th percentile down to the 25th percentile. From here, another linear equation is used to calculate scores in the bottom 25th percentile, which is still fairly accurate. Again however, most students interested in calculating their atars will not be in the bottom 25th percentile in the state, and thus the slight inaccuracies are borderline negligible.
Scaled to aggregate
This is trivially simple, literally just adding the best 10 units of scaled marks (including the best two units of english) together to form a number between 0 and 500.
Aggregate to ATAR
The data for the conversion from aggregate to ATAR is once again on the UAC scaling report, in table A9. This relationship isn't a linear equation. Thus, to convert from aggregate to atar, a set of polynomials was created using a series of Lagrange interpolations. This was difficult to get perfect when including every data point, so polynomials were generated every 3-4 data points, with a 1 data point buffer on either side. The resultant overlapping polynomials were averaged out to generate a piecewise function with a ± 0.0008 atar accuracy. Pretty dang accurate. The resultant atar was then simply rounded to the nearest 0.05 (as all ATAR's are), and then displayed on screen.
Other information
This ATAR calculator was influenced by @carrotsss on the Bored of Studies forum, who created a similar calculator using data from 2022, and housed it in a Google Sheet.
His calculator inspired me to create this one, with up-to-date data for the new cohort, and a slightly nicer design and user experience.
The supported subjects for both aligned & scaled marks, and ATAR calculation are (currently):
Maths (standard & advanced), maths ext1, maths ext2, physics, bio, chemistry, economics, business studies, legal studies, modern & ancient history, software design and development, engineering & english (standard & advanced).
To reiterate, please take this calculator as a guide only. This calculator isn't magic. It's a series of functions and polynomials that attempt to model what your ATAR should look like,
given the set of assumptions we established earlier. If you have any questions, or wish to report any bugs, head here and open a "new issue".
Thanks guys, and good luck!